The baudline scientific visualizer was used to investigate some eerie Saturn radio emissions captured by the Cassini spacecraft. NASA believes that the source of these radio waves are related to the auroras near the poles of Saturn. The 27 minute radio emission signal was collected by Cassini's radio and plasma wave instrument and has been compressed down to a 73.5 second audio file for playback.
This signal looks and sounds a lot like Earth VLF chorus with fading blobs of spectrum moving up and down in frequency. The large blocks visible throughout the spectrogram are interesting looking artifacts that could be synthesis or compression related. Another interesting artifact are the horizontal scan lines that can be seen in the zoomed in spectrogram image below:
The NTSC-like horizontal scan line artifacts could be synthesis based or they could be related to how the Cassini sensors operate. Baudline's periodicity bars measured the scan lines to have a repetitive spacing of 0.1487 seconds which when multiplied by the 5000 sample becomes 743.5 samples. Adjusting for a 73.5 second to 27 minute file expansion, a reciprocal factor of 22.04, the number of samples becomes 16386.7 samples which is very close to 16384 a power of 2 and a popular buffer size.
Showing posts with label VLF. Show all posts
Friday, March 14, 2008
Sunday, May 07, 2006
VLF whistler echo train
The baudline VLF analyzer was used to investigate a whistler natural radio emission signal file from the NASA INSPIRE VLF project web page:
http://image.gsfc.nasa.gov/poetry/inspire/advanced.html
A whistler is an atmospheric electrical event that has traveled a very long distance. Usually a whistler is sent out into space and is curved back to earth along magnetic field lines. This long distance allows for a large amount of frequency dispersion which causes a lot of curvature. The original sferics wideband pulse is bent into what looks like an exponential downward sweep.
On the advanced INSPIRE VLF page is a whistler echo train signal file called 6whistechortra.au. It is consists of a primary whistler event and six echoes that are clearly visible in the baudline spectrogram image below:
The NASA INSPIRE page says:
This increase in dispersion time can be seen in the spectrogram as the whistler echoes becoming increasingly bent. The lower frequencies travel slower than the higher frequencies. What's interesting is how uniform the dispersion is as a function of frequency. Baudline's periodicity measurement bars are a perfect tool for investigating this phenomena. A frequency point on the exponential whistler curve is chosen and then the periodicity bars are stretched and dragged to make the measurement. See the baudline spectrogram image below: (click image for a clearer view of the periodicity bars)
This delta delay varies from 3.1 seconds at about 5300 Hz to 4.5 seconds at 2200 Hz. The periodicity bar measurements line up perfectly at every frequency so these are true echoes and the delta delay is a function of frequency.
The speed of light is about 300,000 km/sec (186,000 miles/second). The shortest whistler echo delay at the highest frequency is 3.1 seconds. So if a constant speed of light whistler velocity is assumed, which it isn't, then the distance traveled equals 930,000 km. The Earth - Moon distance is 384,000 km, so the whistler echo distance traveled is roughly equal to a circular path (diameter * pi) to and from the Moon. This is just speculation and without more detailed information about the whistler echo recording it impossible to say for certain that an Earth - Moon circular path is happening. What is known is that the whistler echoes are traveling a very long distance.
Another interesting observation is by the time of the 4th echo return that the high frequency head of the signal has caught up with the low frequency tail and passed it. The whistler thickness is also increasing with each subsequent echo, so given enough duration, the exponential whistler will dissolve into white noise (equal energy at every frequency) and become spectrally flat.
Fascinating. A lot of physics is going on in this whistler echo train signal.
http://image.gsfc.nasa.gov/poetry/inspire/advanced.html
A whistler is an atmospheric electrical event that has traveled a very long distance. Usually a whistler is sent out into space and is curved back to earth along magnetic field lines. This long distance allows for a large amount of frequency dispersion which causes a lot of curvature. The original sferics wideband pulse is bent into what looks like an exponential downward sweep.
On the advanced INSPIRE VLF page is a whistler echo train signal file called 6whistechortra.au. It is consists of a primary whistler event and six echoes that are clearly visible in the baudline spectrogram image below:
The NASA INSPIRE page says:
"Echo trains result when the radio wave bounces back and forth between magnetic conjugate points. Each time the signal bounces off the ionosphere, some of the energy leaks down in the lower atmosphere and is heard as a whistler. All of the whistlers in the train are the result of a single lightning stroke. Successive "hops" of the whistler are seen with increasing dispersion time as the distance traveled grows with each bounce."
This increase in dispersion time can be seen in the spectrogram as the whistler echoes becoming increasingly bent. The lower frequencies travel slower than the higher frequencies. What's interesting is how uniform the dispersion is as a function of frequency. Baudline's periodicity measurement bars are a perfect tool for investigating this phenomena. A frequency point on the exponential whistler curve is chosen and then the periodicity bars are stretched and dragged to make the measurement. See the baudline spectrogram image below: (click image for a clearer view of the periodicity bars)
This delta delay varies from 3.1 seconds at about 5300 Hz to 4.5 seconds at 2200 Hz. The periodicity bar measurements line up perfectly at every frequency so these are true echoes and the delta delay is a function of frequency.
The speed of light is about 300,000 km/sec (186,000 miles/second). The shortest whistler echo delay at the highest frequency is 3.1 seconds. So if a constant speed of light whistler velocity is assumed, which it isn't, then the distance traveled equals 930,000 km. The Earth - Moon distance is 384,000 km, so the whistler echo distance traveled is roughly equal to a circular path (diameter * pi) to and from the Moon. This is just speculation and without more detailed information about the whistler echo recording it impossible to say for certain that an Earth - Moon circular path is happening. What is known is that the whistler echoes are traveling a very long distance.
Another interesting observation is by the time of the 4th echo return that the high frequency head of the signal has caught up with the low frequency tail and passed it. The whistler thickness is also increasing with each subsequent echo, so given enough duration, the exponential whistler will dissolve into white noise (equal energy at every frequency) and become spectrally flat.
Fascinating. A lot of physics is going on in this whistler echo train signal.
Saturday, April 08, 2006
VLF sferics, tweeks, whistlers
The baudline VLF analyzer was used to investigate some natural radio emission signal files on the NASA INSPIRE VLF project web page:
http://image.gsfc.nasa.gov/poetry/inspire/basic.html
The NASA INSPIRE page has audio samples of sferic, tweek, and whistler signals. The sample rate for all of the .au format files is 22050 for an effective Nyquist bandwidth of 11025 Hz.
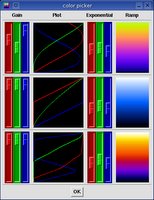
Fine adjustment of baudline's Color Aperture, Color Picker, and Windowing controls were performed in order to extract the maximum amount of detail from the VLF signal files. The sferic, tweek, and whistler signals used three different color palettes. See the Color Picker window on the right for the respective RGB curves and spectrogram color ramps.
Sferics
Sferics are caused by lightning and they have spectrums that consist of wideband spectral pulses (horizontal lines). Like a spark gap transmitter, they have infinite bandwidth but the analog capture hardware, digital sampling rate, and atmospheric conduction channel limit this.
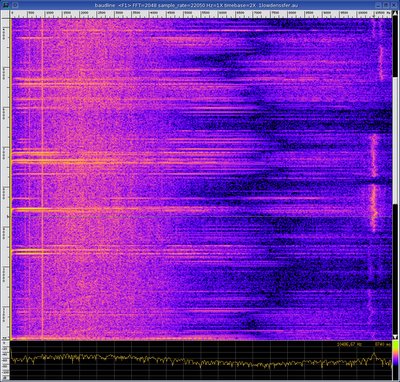
The above spectrogram is the low density sferics data file and it has a number of interesting signal features:
The above spectrogram is the dense sferics data and it is very similar to the previous sferics data file but it has some interesting feature differences. The sferics have a much higher density, the strong tones below 1000 Hz are gone, and the wandering null is a little lower at 6000 Hz. New is a decreasing bass chirp that is exponential from 100 to 20 Hz. I'm not sure if this bass chirp is real or if it is an artifact of the collection hardware.
Tweeks
Tweeks are sferics that travel a long distance through the upper atmosphere. Since velocity is a function of wavelength, higher frequencies travel faster than lower frequencies. This phenomena is called dispersion and it manifests itself in the spectrogram as a bending of the straight wideband spectral pulse of the sferic.
The spectral "hooks" between 1700 and 1900 Hz are caused by dispersion. Between 250 to 1000 Hz is an interesting flat spectral region that looks like it is unaffected by dispersion. There are also a number of constant tones but at different frequencies in the sferic's spectrogram. These constants tones are likely collection artifacts or RFI.
Whistlers
A whistler is essentially a sferic that has traveled an even longer distance than a tweek. Usually a whistler is sent out into space and is curved back to earth along magnetic field lines. This longer distance allows for even more dispersion than what a tweek experiences. More distance means more dispersion which causes more curvature. The original sferics wideband pulse is bent into what looks like an exponential downward sweep. See the spectrogram image below:
In the above spectrogram image note that some sferics are mixed in with the whistlers to create a compound image. The 10500 Hz wandering tone that was seen in the sferic's spectrogram has returned. There also several constant tones but they are at slightly different frequencies than the tones that were visible in the sferic and tweek images. Again, collection artifacts or RFI are likely to blame.
In summary; a whistler is a long distance version of a tweek which is a long distance version of a sferic. The VLF signals all start as lightning and velocity dispersion does the rest.
http://image.gsfc.nasa.gov/poetry/inspire/basic.html
The NASA INSPIRE page has audio samples of sferic, tweek, and whistler signals. The sample rate for all of the .au format files is 22050 for an effective Nyquist bandwidth of 11025 Hz.
Fine adjustment of baudline's Color Aperture, Color Picker, and Windowing controls were performed in order to extract the maximum amount of detail from the VLF signal files. The sferic, tweek, and whistler signals used three different color palettes. See the Color Picker window on the right for the respective RGB curves and spectrogram color ramps.
Sferics
Sferics are caused by lightning and they have spectrums that consist of wideband spectral pulses (horizontal lines). Like a spark gap transmitter, they have infinite bandwidth but the analog capture hardware, digital sampling rate, and atmospheric conduction channel limit this.
The above spectrogram is the low density sferics data file and it has a number of interesting signal features:
- Multiple sferic lightning pulses stretch from 30 Hz to the Nyquist frequency of 11025 Hz.
- A wandering null at around 7000 Hz.
- A strong tone at 926 Hz throughout the entire file.
- Four weaker tones at 184, 308, 432, 556 Hz look like harmonics but they have a delta spacing of 124 Hz. These solid tones are likely artifacts from the capture hardware.
- High frequency wandering tones at 10500 Hz.
The above spectrogram is the dense sferics data and it is very similar to the previous sferics data file but it has some interesting feature differences. The sferics have a much higher density, the strong tones below 1000 Hz are gone, and the wandering null is a little lower at 6000 Hz. New is a decreasing bass chirp that is exponential from 100 to 20 Hz. I'm not sure if this bass chirp is real or if it is an artifact of the collection hardware.
Tweeks
Tweeks are sferics that travel a long distance through the upper atmosphere. Since velocity is a function of wavelength, higher frequencies travel faster than lower frequencies. This phenomena is called dispersion and it manifests itself in the spectrogram as a bending of the straight wideband spectral pulse of the sferic.
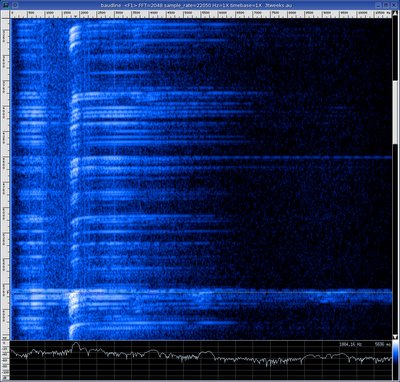
The spectral "hooks" between 1700 and 1900 Hz are caused by dispersion. Between 250 to 1000 Hz is an interesting flat spectral region that looks like it is unaffected by dispersion. There are also a number of constant tones but at different frequencies in the sferic's spectrogram. These constants tones are likely collection artifacts or RFI.
Whistlers
A whistler is essentially a sferic that has traveled an even longer distance than a tweek. Usually a whistler is sent out into space and is curved back to earth along magnetic field lines. This longer distance allows for even more dispersion than what a tweek experiences. More distance means more dispersion which causes more curvature. The original sferics wideband pulse is bent into what looks like an exponential downward sweep. See the spectrogram image below:
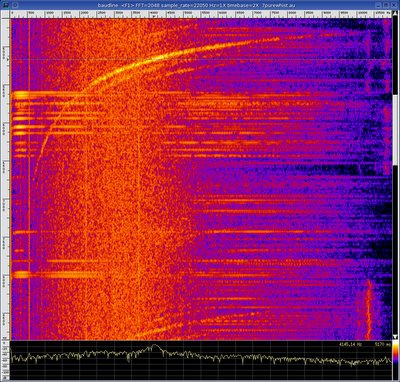
In the above spectrogram image note that some sferics are mixed in with the whistlers to create a compound image. The 10500 Hz wandering tone that was seen in the sferic's spectrogram has returned. There also several constant tones but they are at slightly different frequencies than the tones that were visible in the sferic and tweek images. Again, collection artifacts or RFI are likely to blame.
In summary; a whistler is a long distance version of a tweek which is a long distance version of a sferic. The VLF signals all start as lightning and velocity dispersion does the rest.
Subscribe to:
Posts (Atom)