Fourier
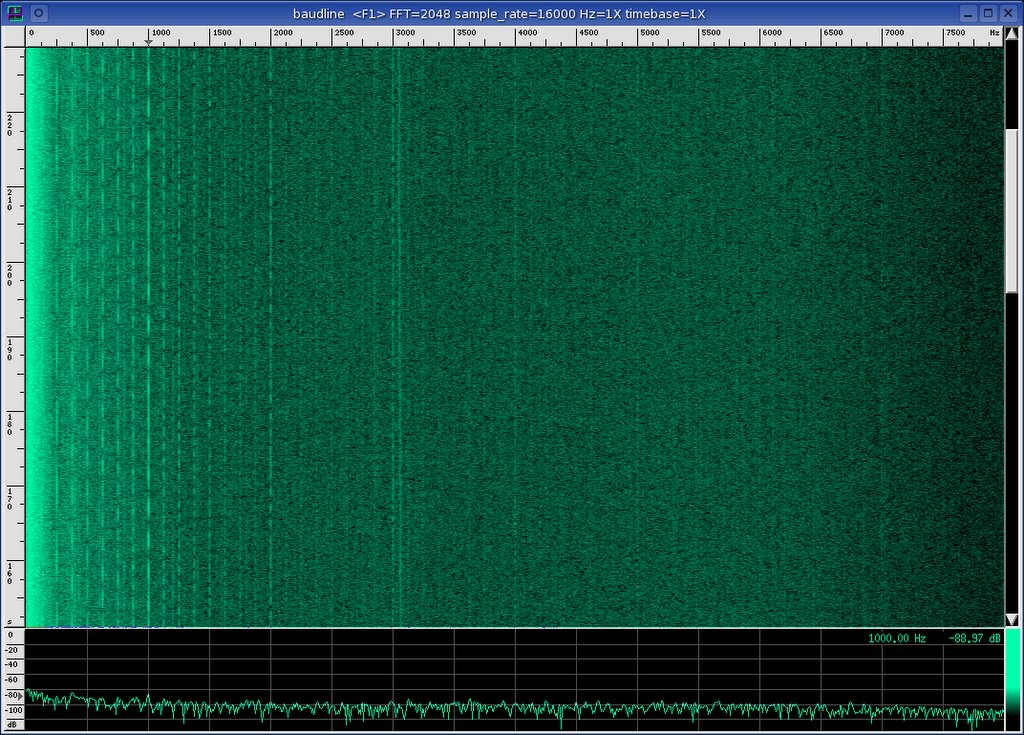
Strong 125 Hz harmonics look like pulsing tones from 125 Hz to 2000 Hz. Harmonics of 1000 Hz are also present (2000, 3000, 4000, 5000 Hz). An unusual and unrelated tone is at 3080 Hz. The higher end of the spectrum is fairly flat.
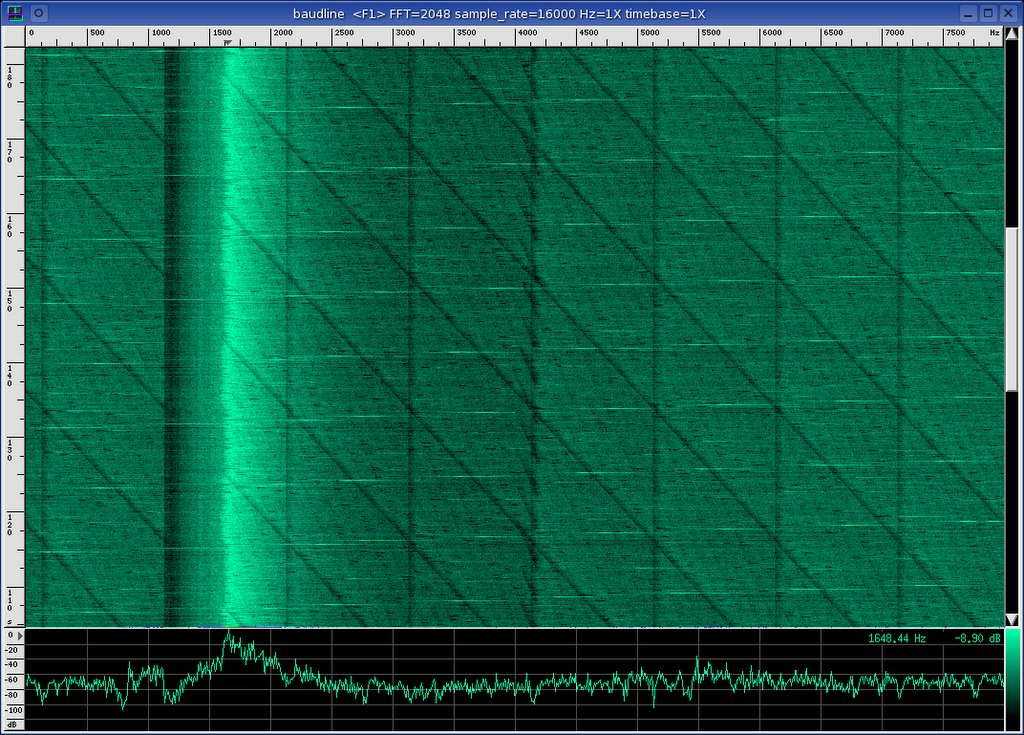
 The spectral bump near 0 Hz (DC) is actually made up of periodic broadband pulses that repeat at 0.128 second intervals (2048 samples @ 16000 rate). For a view with increased detailed see the zoomed Fourier spectrogram image on the right. The pulse shapes are that of downward exponential chirps. Occasional 0.064 second period doubles are interspersed. The 64 and 128 ms measurements hint at powers of 2 and at DMA packet transfers.
Autocorrelation

The above image is the Autocorrelation transform with the square windowing function. The Hilbert filter operation was utilized to remove DC and low frequency components that obscure the transform display. The horizontal frequency ruler in this image is incorrect and the units should be samples. The strong spectrogram lines at 1000, 2000, 3000, 4000 Hz, ... represent 128, 256, 384, and 512 samples. What look like weaker harmonics in between the 128 sample tones have spacings of 16 samples The crisscross diagonal lines are fascinating.
Sample Raster
The sample Raster transform has an overlap spacing of 2048 samples. This transform can be thought of as stacked waveforms like a TV raster display. The horizontal units are not Hz but samples. Like the Autocorrelation transform, the sample Raster transform has strong vertical lines at 1000 Hz spacings which convert to 128 samples. Also similar are the diagonal lines that in this case only ramp up. A strong line sync structure exists in the 1000 to 2000 Hz zone. The lower spectrum region is identical to the Waveform window with an AGC linear space function.
The exact cause of these bizarre spectrogram patterns is unknown but CPU and PCI bus noise interference is suspected. For further noise and distortion analysis of the CS4236B and other DAQ's see this baudline solution report:
http://www.baudline.com/solutions/full_duplex/
No comments:
Post a Comment