Friday, March 17, 2006

Kororaa Linux Xgl LiveCD

We recently downloaded the Kororaa Project's Xgl Demo Live CD (Version 0.1) to test out the new Xgl and Compiz technologies. A LiveCD is a simple and painless way of auditioning Linux without the hassle of installation. The transparency, motion, and 3D effects looked extremely cool and we had to give it a try.

Our test machine was a 2.0 GHz Pentium 4, 512 MB RAM, GeForce4 MX 440 (64 MB) video card, Sound Blaster 16 PCI card, on-board VIA 8235 sound chip, and a Labtec 704 USB microphone. The Kororaa LiveCD booted up fine but the mouse and window responsiveness was horrifically slow. Something was definitely wrong and our 2 GHz machine seemed more like a 2 MHz machine. Restarting with the "kororaa noapic" boot options solved the problem. Our first reaction was "Wow, this is awesome!"

Next we fired up baudline, performed some testing, and the screenshots are below.

Opaque Transparency
With the Compiz window manager the Ctrl+Shift+wheel key/mouse sequence adjusts a window's transparency. Windows can be made partially opaque which can be used in a powerful way with baudline.


In the above image; the Tone Generator is creating a FM sine sweep and the aliasing makes for some interesting spectrogram patterns. The Waveform and Histogram windows are visible but since they are transparent they don't block the green spectrogram window. This is a very effective method of maximizing limited screen real estate.
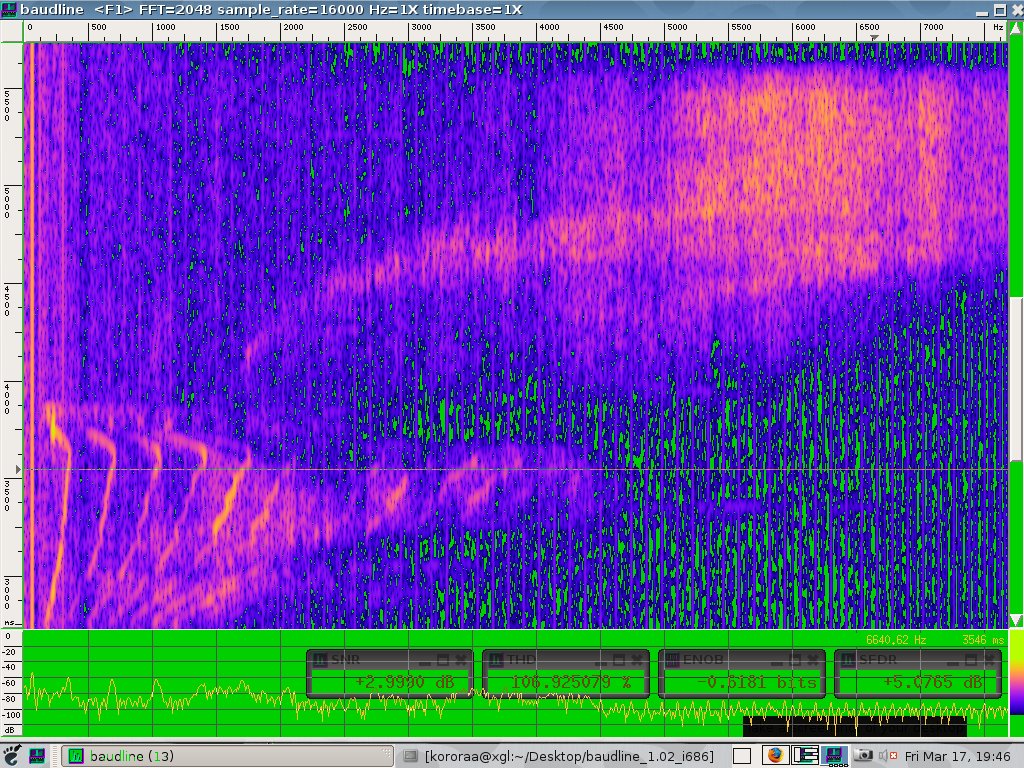

In the image above; the yellow-pink-blue spectrogram takes up the entire 1024x768 screen (except for the Gnome tool bar at the bottom). The SNR, THD, ENOB, and SFDR distortion measurement windows are transparent and they don't obscure the main display.

Spinning Cube
The virtual workspace is switched by Ctrl+Alt+mouse_button or Ctrl+Alt+arrows key combinations and the green and pink baudline spectrogram sessions spin around in an animated fashion. Makes me dizzy but it is groovy!


Jiggly Jello
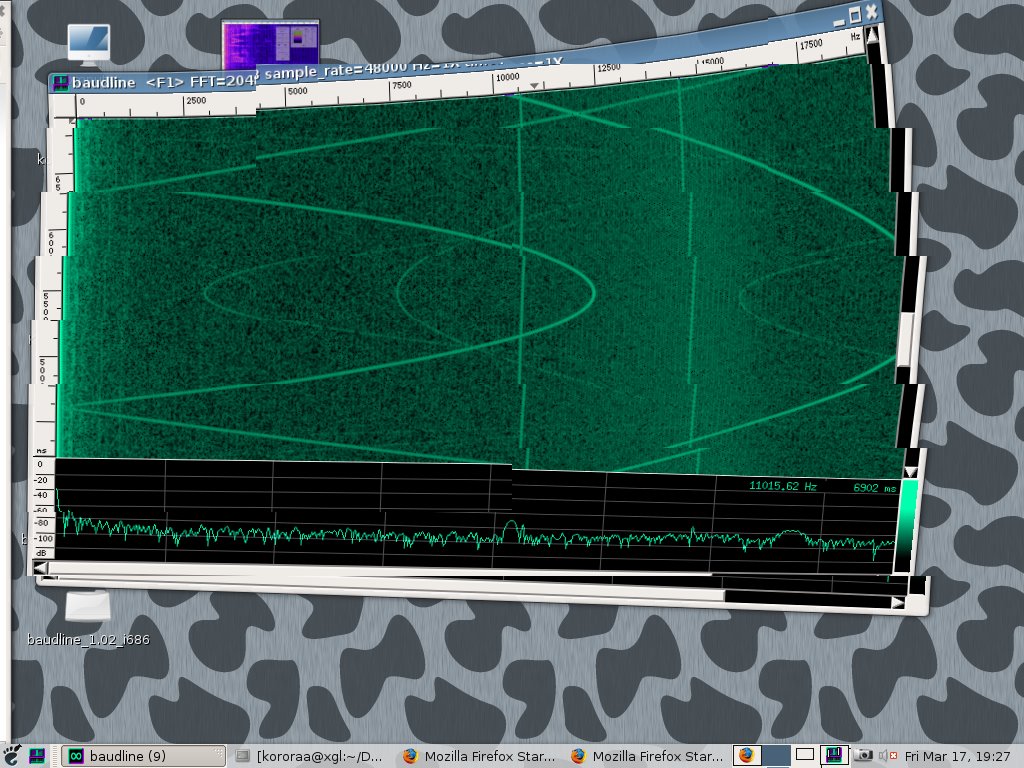
Shake the title bar like a Polaroid picture and the window acts like jiggly jello. Unfortunately the image below doesn't do this feature justice. The motion is clean, smooth, and fluid. Nice physics implementation of the dynamics and the Q damping factor. This feature is a lot of fun to experiment with. (:


Observations
Baudline ran extremely well on Kororaa v0.1, better than on most LiveCDs, but there were some minor quirks:

  1. Minor screen and window sizing problems. The Metacity window manager was replaced by Compiz. Some code tuning for Compiz has been added to the baudline TODO list.
  2. Only 2 audio cards were mounted and our USB audio mic could not be used We think this is a kernel setup limitation.
  3. Xgl uses an incredible amount of CPU resources and the baudline scrolling speed is slow. The screen is double buffered for the 3D engine and this adds a large overhead. Our 2 GHz machine runs baudline with very high performance (3000 FFTs/seconds with a 100+ FPS scrolling speed). With the Kororaa CD the baudline performance was equivalent to a 200 MHz x86 with a low end graphics card running a traditional X-Server. All of that fancy 3D FX are expensive.
  4. The default (-reset) baudline performance on Kororaa was 150 FFTs/second and a 30 FPS rate. Most modern machines have no problem rendering a 125 FPS rate. By restarting baudline with the "-backingstore -xslip 1" command line parameters a 50% frame rate improvement to 45 FPS was possible. Xgl uses a double buffer scheme so the -backingstore flag is just taking advantage of what is already running.


Conclusion
Kororaa, Xgl, and Compiz are very cool. Compiz could be a little more feature rich such as adding window raising, lowering, stay on top, and stickies. Baudline could use some minor tweaks and tuning for Compiz. Our 2 GHz Pentium 4 and GeForce4 MX 440 machine is really pushing the bottom of the performance envelope while running baudline. Kororaa with a dual core 3.4 GHz P4 and a top of the line Nvidia card would be an amazing machine to run baudline on.

For the best Kororaa Xgl performance remember to startup baudline with the following command line:

baudline -backingstore -xslip 1

Saturday, March 11, 2006

Yanmar 1-cylinder diesel

This sound clip is a Yanmar Marine 1-cylinder 4-stroke reciprocating diesel engine at idle. The signal was recorded with a GSM cell phone through the Audioblogger system.

this is an audio post - click to play


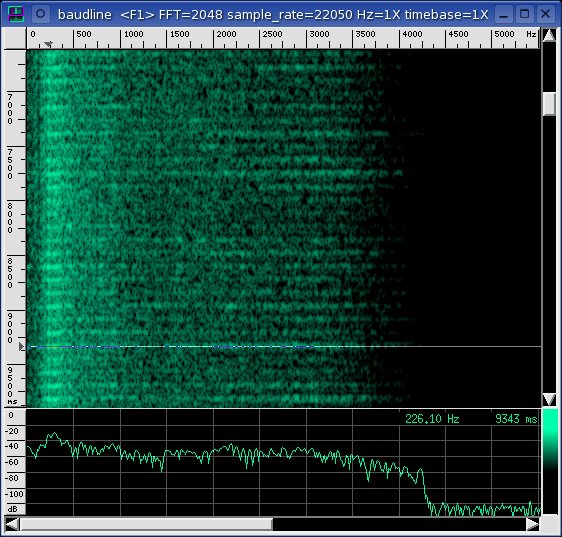
The baudline FFT analyzer created the time-frequency spectrogram image below:


Baudline's periodicity bars were used to measure an accurate 0.121 second delta between pulses. This works out to 8.26 pulses/second or 496 PPM (Pulses Per Minute). Since the Yanmar is a 4-stroke reciprocating engine, multiplication by 2 will calculate RPM. So: 496 * 2 = 992 RPM which is close to the engine's idle warm-up speed.

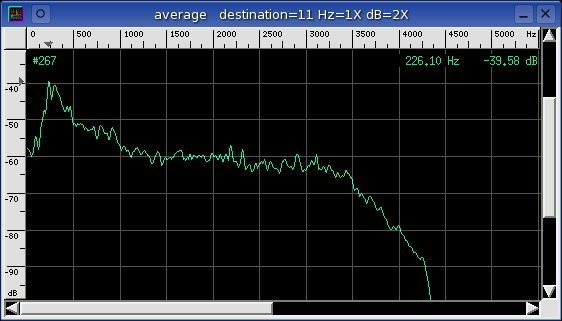
A section of spectrogram data was copy-n-pasted into the average spectrum window shown below:


There are two strong peaks of unknown source at 230 Hz and 300 Hz. The exhaust note is an unlikely candidate since it is piped outside the cabin. The air intake and/or the hull resonance are suspected. The recording does not convey the loud pounding sound of the 1-cylinder engine which could be mechanical in nature. The two strong peaks are likely a combination of a couple of the previously mentioned signal sources.

Go Eyrie!

Friday, March 03, 2006

Harddisko - audio techno art

Harddisko is an acoustic technological art project that uses defective hard drives to create fascinating rhythmic noises. "Special sound pickups" attached to the drive heads capture the audio signal while an electrical sequencer controls the hard drive's power-on initialization. Detailed information and sound clips about Harddisko can be found here:

http://harddisko.ch.vu

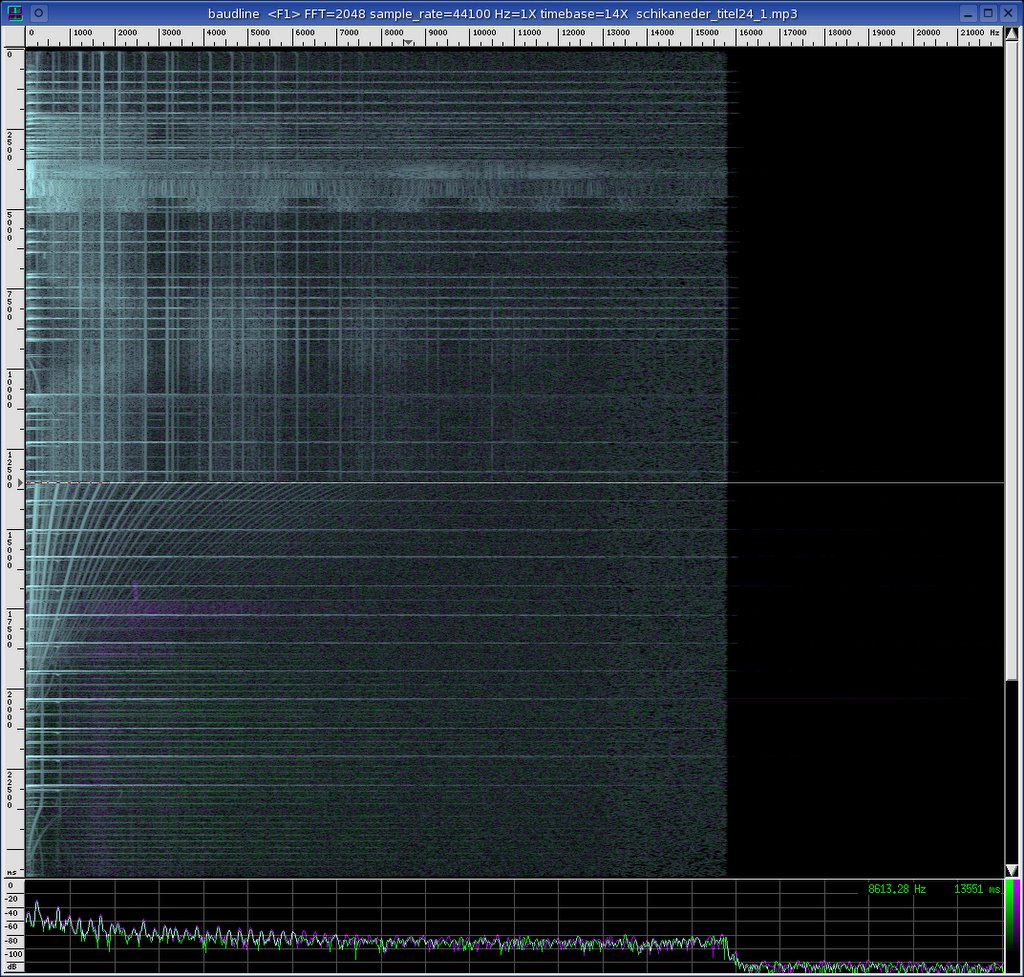
Track "Schikaneder4.mp3" was loaded into the baudline time-frequency browser and the stereo spectrogram is displayed below. Clicks, blips, bleeps, head chatter, rich harmonics, and rotational power ramps are visible. It is music to my eyes!


The black bar on the right is caused by MP3 encoding only 16kHz of bandwidth. Notice the right purple channel in the final third of the orchestral piece.

Wednesday, March 01, 2006

Khoomei Acoustic Analysis

Khoomei is a form of throat singing used in traditional music from Tuva. In fact, khoomei is Mongolian for the word "throat." What makes throat singing amazing is that a single person can generate multiple voices at one time.

The baudline spectrum analyzer was used to analyze track 6 from Huun-Huur-Tu's CD "60 Horses in My Herd." A sample of the audio file (kokhoomei.mp3) can be found here:

http://www.khoomei.com/spec.htm

The baudline spectrogram image below is a 10 second cut that displays 16kHz of bandwidth. The purple and green colors represent the left and right channels.


Four distinct voices are visible amongst the rich harmonic structure. A constant drone, the fundamental at 109 Hz is the foundation. This sound is made from the throat and the third harmonic is about 10 dB louder than the fundamental. The second voice looks like stair steps and is in the 700 to 1500 Hz range. The third voice looks a lot like a mirror image of the second voice and is in the 2500 to 3000 Hz range. The forth voice is in the 3300 to 3500 Hz range. The complex and interesting shapes above 4000 Hz are nasal and breathing sounds.

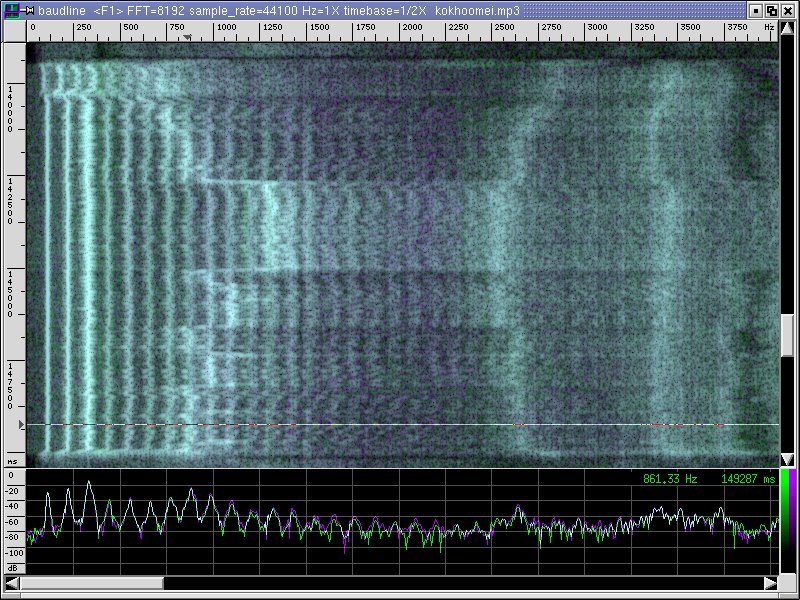
The next spectrogram is the same 10 second cut as above but the frequency axis has been zoomed in to display 4kHz of bandwidth. This zoomed view shows better detail of the harmonic structure.


Two features are very interesting in this spectrogram.

1) The frequencies of the second voice (700 - 1500 Hz) are being limited to values that are harmonics. This means that every note is a multiple of the fundamental and that frequencies in between are not possible. This observation hints at how this unique sound is being produced. Parts of the spectrum are being attenuated or amplified by a cavity resonance like filter process.

2) The third voice (2500 -3000 Hz) looks like a mirror image of the second voice. When the seconds voice goes up the third voice goes down and vice versa. It is not an exact mirror image but 1900 Hz looks like the center pivot frequency. Non-linear processes such as decimating or sample rate conversion without filtering create a similar form of aliasing. Exactly how this relates to the mechanics at work in the vocal tract is unknown.

Links
http://fotuva.org
http://en.wikipedia.org/wiki/Khoomei
http://www.yogimont.net/jia/overtonesinging
http://www.sciam.com/article.cfm?articleID=00080AA2-BA32-1C73-9B81809EC588EF21

Wednesday, February 22, 2006

Audioblogger.com QoS T&'M

Purpose
Determine the quality of service (QoS) of the Audioblogger.com system by performing some test and measurement (T&M) on the signal channel.

Procedure
Input a known test signal over a GSM cell phone to the Audioblogger system and then perform distortion analysis on the captured data file. Constant sine wave, linear sine sweep, and white Gaussian noise test signals were created by baudline's function generator. These test signals were played back by a CS4236B codec to Altec Lansing ACS48 speakers and then to the headset microphone of a Motorola v60 GSM cell phone. The captured Audioblogger file was a 24 kbps MP3 audio file with a 22050 sample rate. Click below to listen:

this is an audio post - click to play


This is a complicated signal path that has many potential points of degradation. It is difficult to guess which step is the weakest link. The signal path consists of:

  1. baudline plays test signal
  2. CS4236B DAC (44100 sample rate)
  3. Altec Lansing ACS48 speakers
  4. headset microphone
  5. Motorola v60 GSM cell phone (4 bars)
  6. carrier's GSM to u-law conversion
  7. Audioblogger machine's ADC (22050 sample rate)
  8. MP3 24 kbps compression


Analysis
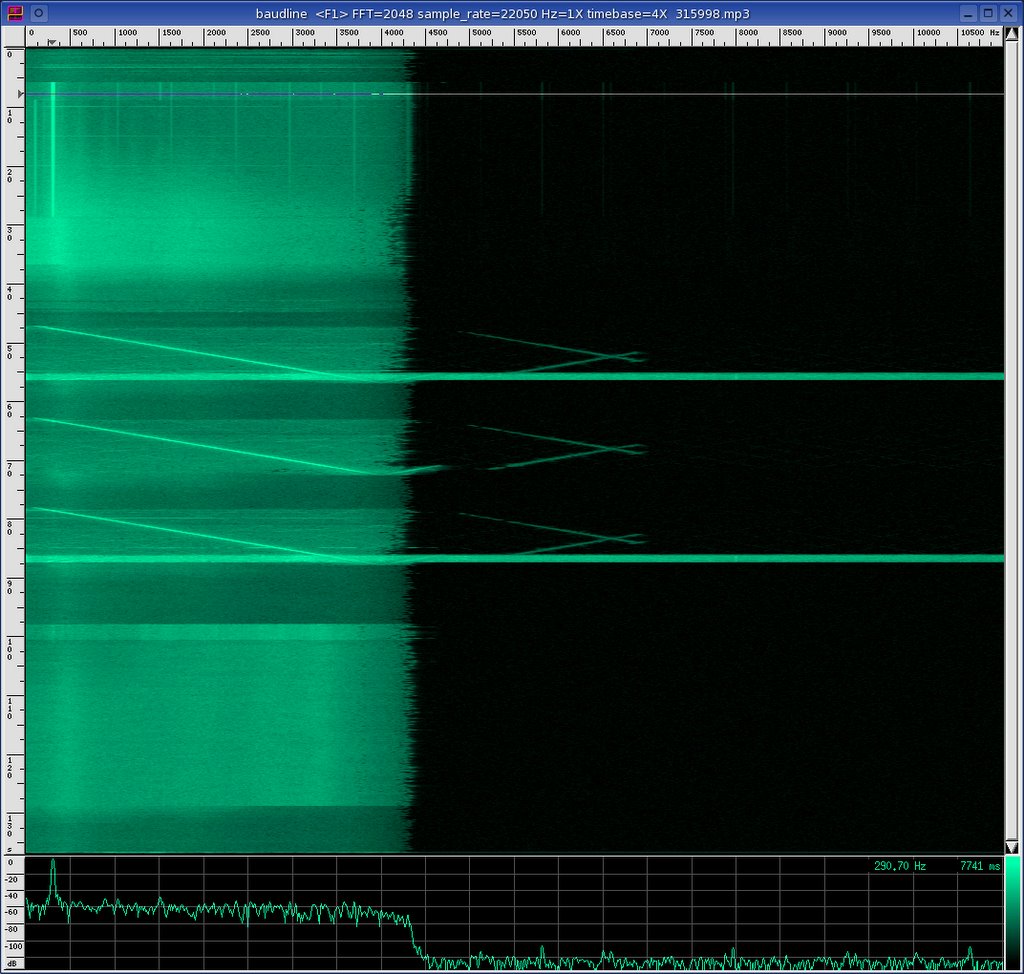
Below is the spectrogram of the entire file. Notice that it is VGC limited at about 4kHz of bandwidth.


The test signal consists of three different test stimuli. From top to bottom. The first section is a constant sine. The second section has three copies of a linear sine sweep. The third and final section is white Gaussian noise (WGN). In between the tests are sections of silence which are used to measure the idle noise floor.

Below is a zoomed timebase version of the first sine wave section.


It looks like an AGC kicks in after about 3 seconds of steady state signal. This isn't good. Signal gain drops by 5 dB and a strong 100 Hz tone appears, then in the final 8 seconds the sine wave looks fizzled out.

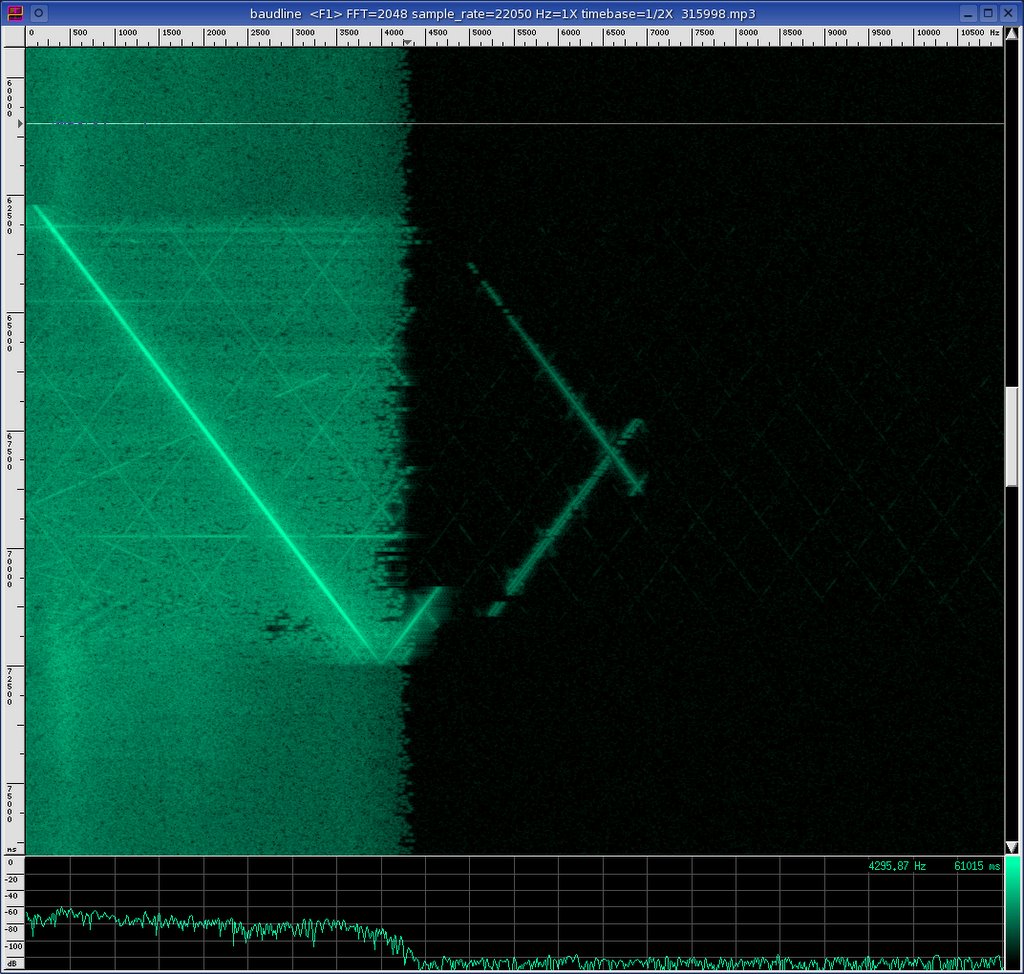
The 2nd linear sine sweep was the cleanest and the zoomed in image is below. The 1st and 3rd sweeps were discarded because they have strong clipping distortion near the end that look like wideband noise. In all three runs notice the crisscross harmonics and the aliasing around the 4kHz Nyquist point.


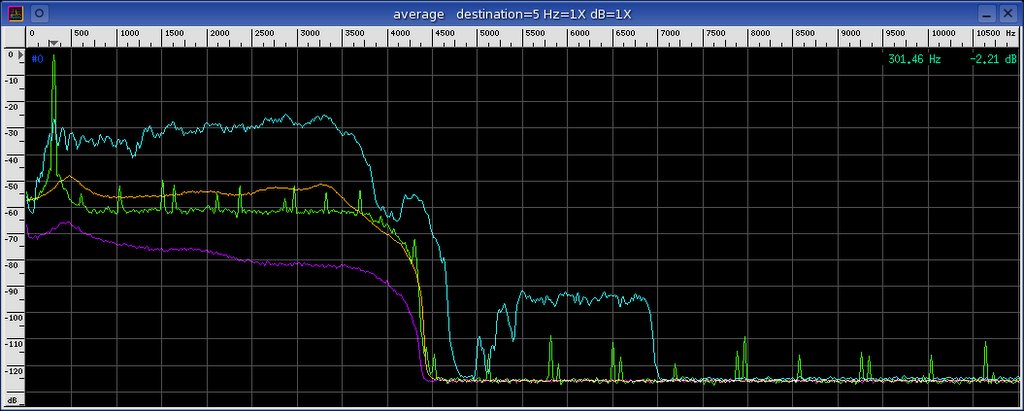
The same baudline DAQ / codec copy-n-paste technique (see references) was used to visualize the individual spectral parts. In the Average window the following colors correspond to the different sections:

  • green - 301.99 Hz sine wave
  • purple - noise floor (silence)
  • orange - white Gaussian noise (WGN)
  • cyan - sine sweep 0 - 4000 Hz


The purple noise floor and orange WGN have subtle peaks at ~460 Hz. The green sine wave has a large number of distortions. The spectrum of the cyan sine sweep is lumpy and resonances are visible. Here are the distortion measurements from the first 2.5 seconds of the sine wave. The numbers drop significantly after that (by about 1.8 bits).

Distortion Metrics:

  • frequency: 301.995 Hz (+16.56 PPM)
  • SNR: +35.16 dB
  • THD: -40.02 dB (0.01 %)
  • SINAD: +33.93 dB
  • ENOB: +5.344 bits
  • SFDR: +41.78 dB


Here are some comparison ENOB's:

  • CS4236B DAC (11.5 bits)
  • GSM 6.10 (8 bits)
  • u-law (6 bits)
  • 24 kbps MP3 (15 bits)


Conclusion
All considered, the final ENOB of 5.3 bits is quite good. The Audioblogger system looks like it will work well for voice. The performance for field recordings is questionable but if all you have is a cell phone then Audioblogger might just be a useful tool.

References
http://www.baudline.com/solutions/full_duplex/
http://www.baudline.com/solutions/codec/

Monday, February 20, 2006

CS4236B PCI bus noise

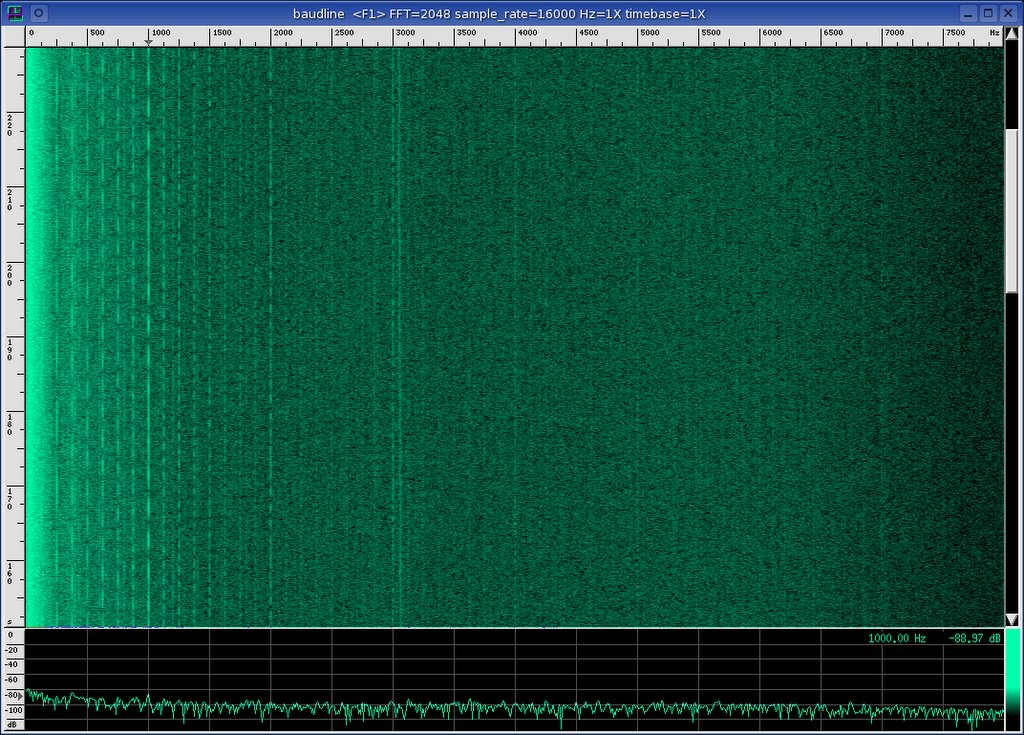
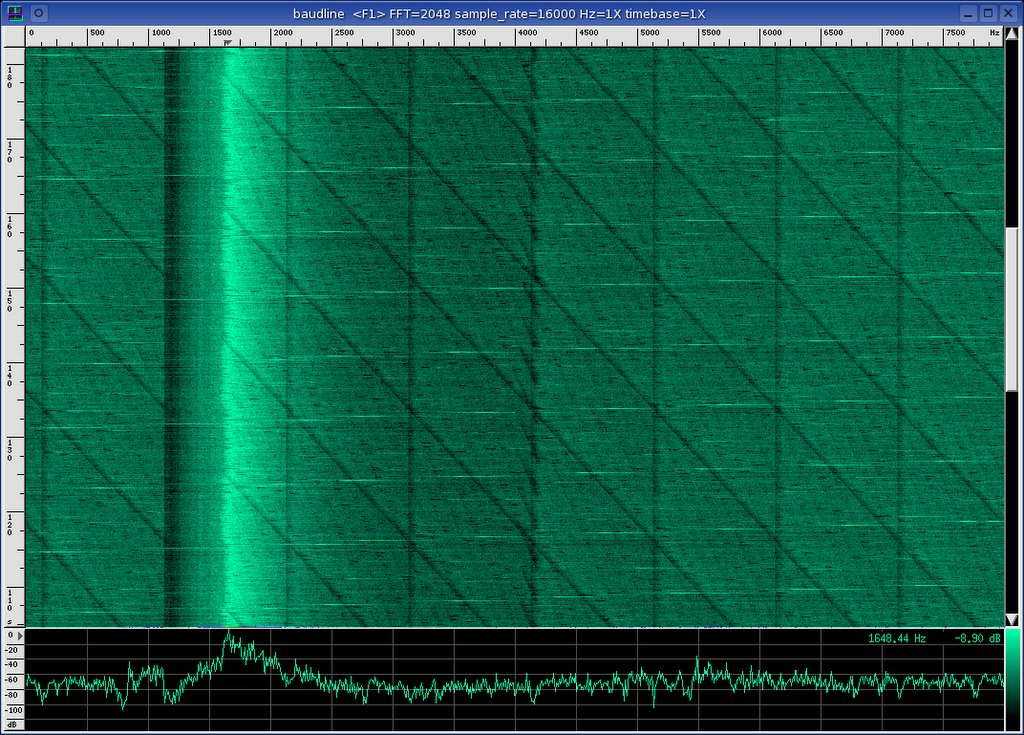
Strange bus noise of an idle CD channel on an integrated CS4236B codec was captured with the baudline signal analyzer. Configuration: 16000 sample per second rate, CD mixer channel selected, 2048 point FFT. No signal was present so a high mixer gain amplified the background idle noise. The resulting interference is very interesting and it is a function of CPU activity. The spectrograms of three transforms reveal a number of mysterious patterns:

Fourier

Strong 125 Hz harmonics look like pulsing tones from 125 Hz to 2000 Hz. Harmonics of 1000 Hz are also present (2000, 3000, 4000, 5000 Hz). An unusual and unrelated tone is at 3080 Hz. The higher end of the spectrum is fairly flat.

The spectral bump near 0 Hz (DC) is actually made up of periodic broadband pulses that repeat at 0.128 second intervals (2048 samples @ 16000 rate). For a view with increased detailed see the zoomed Fourier spectrogram image on the right. The pulse shapes are that of downward exponential chirps. Occasional 0.064 second period doubles are interspersed. The 64 and 128 ms measurements hint at powers of 2 and at DMA packet transfers.

Autocorrelation

The above image is the Autocorrelation transform with the square windowing function. The Hilbert filter operation was utilized to remove DC and low frequency components that obscure the transform display. The horizontal frequency ruler in this image is incorrect and the units should be samples. The strong spectrogram lines at 1000, 2000, 3000, 4000 Hz, ... represent 128, 256, 384, and 512 samples. What look like weaker harmonics in between the 128 sample tones have spacings of 16 samples The crisscross diagonal lines are fascinating.

Sample Raster

The sample Raster transform has an overlap spacing of 2048 samples. This transform can be thought of as stacked waveforms like a TV raster display. The horizontal units are not Hz but samples. Like the Autocorrelation transform, the sample Raster transform has strong vertical lines at 1000 Hz spacings which convert to 128 samples. Also similar are the diagonal lines that in this case only ramp up. A strong line sync structure exists in the 1000 to 2000 Hz zone. The lower spectrum region is identical to the Waveform window with an AGC linear space function.

The exact cause of these bizarre spectrogram patterns is unknown but CPU and PCI bus noise interference is suspected. For further noise and distortion analysis of the CS4236B and other DAQ's see this baudline solution report:

http://www.baudline.com/solutions/full_duplex/

Thursday, February 16, 2006

Crosscorrelation Spectrogram

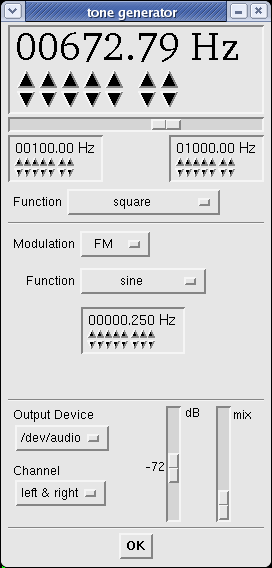
The Tone Generator in baudline was utilized as the test signal source for this demonstration of the Crosscorrelation Spectrogram. A square wave function was FM modulated with a sine wave that had a 100 - 1000 Hz range and a 0.25 Hz modulation frequency. The digital gain was set to a very low -72 dB which resulted in a signal that only had ±1 least significant bit (LSB) flipping. This weak test signal was connected to the data analysis stream by enabling the tone generator loopback option in the Input Devices window.


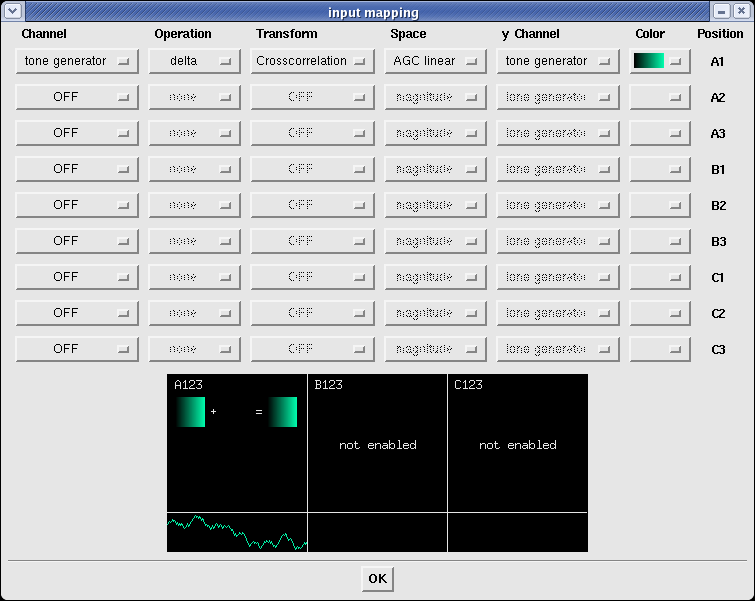
Some advanced baudline wiring configuration was accomplished with the Input Mapping window. First the Crosscorrelation transform with the AGC linear space was selected. Next the delta operation was applied to the left cross channel. This combination results in the Crosscorrelation of the input test signal with it's delta function.


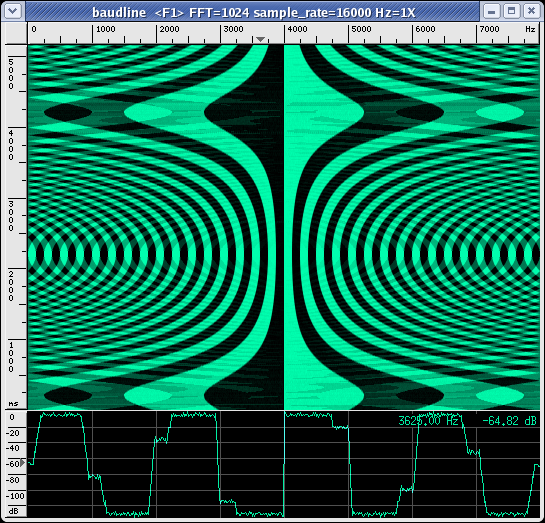
The Autocorrelation of a square wave is a triangle wave but the application of the delta function on one of the Crosscorrelation channels results is a signal that looks like a higher bit version of the original FM modulated square wave. Ahh, the mystery and power of correlation!

The spectrogram image below shows the Crosscorrelation over time while the spectrum region shows a slice. This spectrum slice looks a lot like the original square wave test signal with a center mirror symmetry. Below the main baudline spectro display is the waveform window which shows the delta signal. Note that the top ruler axis isn't really Hz but a time lag.


The spectrogram displays some very interesting folded aliasing patterns that are slightly enhanced by the use of the square windowing function. The spectrum section displays some interesting waveform steps that are a mixture of the source signal and the aliasing.

Sunday, December 11, 2005

Explore, Analyze, and Discover


The baudline signal analyzer is a scientific visualization tool that is designed for exploring the spectral domain. The central spectrogram FFT display is a view into a signal's time-frequency relationship. The Average, Histogram, Measurement, and Waveform windows offer complementary points of view. DSP operations, zooming, scrolling, and focus controls aid in the discovery process.

Input sources

  • data files (raw and popular audio formats)
  • audio device (/dev/audio)
  • standard input (UNIX pipeline)

Baudline is an X11 based application that runs on Linux and FreeBSD. For more information see:

http://www.baudline.com