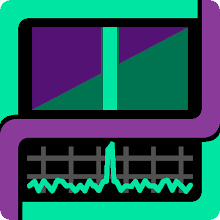
This signal looks and sounds a lot like Earth VLF chorus with fading blobs of spectrum moving up and down in frequency. The large blocks visible throughout the spectrogram are interesting looking artifacts that could be synthesis or compression related. Another interesting artifact are the horizontal scan lines that can be seen in the zoomed in spectrogram image below:

The NTSC-like horizontal scan line artifacts could be synthesis based or they could be related to how the Cassini sensors operate. Baudline's periodicity bars measured the scan lines to have a repetitive spacing of 0.1487 seconds which when multiplied by the 5000 sample becomes 743.5 samples. Adjusting for a 73.5 second to 27 minute file expansion, a reciprocal factor of 22.04, the number of samples becomes 16386.7 samples which is very close to 16384 a power of 2 and a popular buffer size.