This Voyager data set was collected from the multicast UDP packets output by one of SonATA's channelizers. The format is different from previous baudline/setiQuest analyses. It is 16-bit quadrature samples but more importantly it is packetized and contains two polarizations. A simple strip_header demux program was created for this analysis.
The following command line was used to stream the Voyager data file into baudline:
cat vger-2010-07-14-406.pktdata | strip_header | baudline -session voyager -stdin -format le16 -channels 2 -quadrature -samplerate 546133
8419.53 MHz
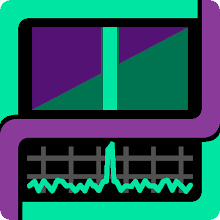
The Voyager signal is so weak that the spectrogram looks like noise. Accumulating spectral curves with the Average display (green Fourier below) to reduce the variance of the noise floor doesn't help. Enabling baudline's Auto Drift algorithm (purple below) changes the situation and the drifting signal pops out of the noise.

The standard Fourier transform found a flat featureless spectrum. Auto Drift found a strong signal near +11200 Hz about 10 sigma above the noise floor that has a -0.473 Hz/sec drift rate. Let us zoom in and inspect this signal is greater detail.
+11689 Hz
Decimation by 2048 and a 2048 point FFT for a 0.26 Hz/bin resolution gives a better view. Here is baudline's spectrogram display:

The Voyager telemetry signal is Doppler drifting at a very linear -65.4 Hz / 139 seconds = -0.471 Hz/second rate due to the Earth's rotation. This manual drift rate measurement matches the Auto Drift rate value to within an error ±0.002 Hz/sec.
Conclusion
Baudline's Auto Drift feature made finding the drifting Voyager signal extremely easy. After it was found in the Average display the spectrogram display was zoomed and scrolled into position. A -0.47 Hz/sec drift rate seems a bit high. Need to check with the SETI Institute if this is a reasonable value. Next step demodulation ...
Links
- http://setiquest.org/forum/topic/baudline-analysis-voyager
- http://www.nasa.gov/vision/universe/solarsystem/voyager_agu.html
- http://twitter.com/NASAVoyager2
Data licensed through SETI.
Software licensed through SigBlips.