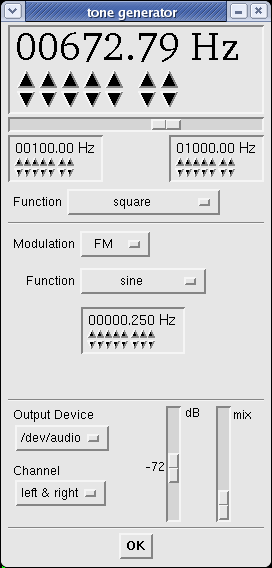
 The Tone Generator in baudline was utilized as the test signal source for this demonstration of the Crosscorrelation Spectrogram. A square wave function was FM modulated with a sine wave that had a 100 - 1000 Hz range and a 0.25 Hz modulation frequency. The digital gain was set to a very low -72 dB which resulted in a signal that only had ±1 least significant bit (LSB) flipping. This weak test signal was connected to the data analysis stream by enabling the tone generator loopback option in the Input Devices window.
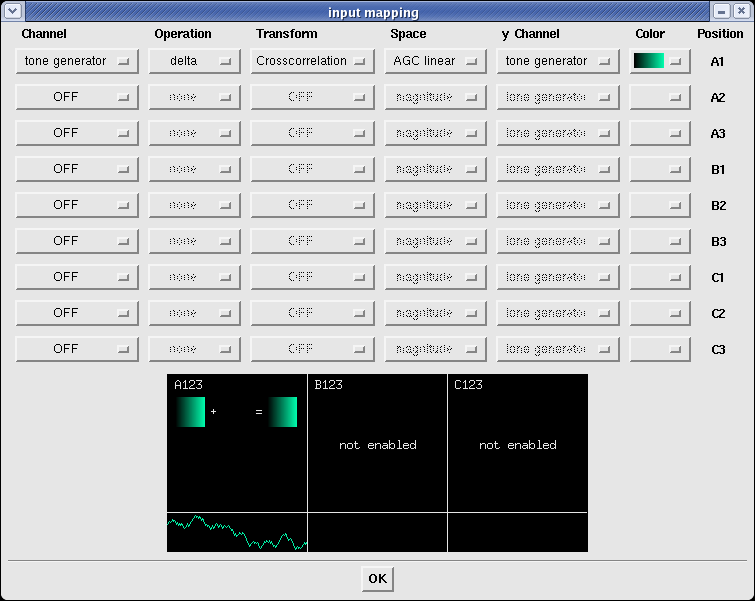 Some advanced baudline wiring configuration was accomplished with the Input Mapping window. First the Crosscorrelation transform with the AGC linear space was selected. Next the delta operation was applied to the left cross channel. This combination results in the Crosscorrelation of the input test signal with it's delta function.
The Autocorrelation of a square wave is a triangle wave but the application of the delta function on one of the Crosscorrelation channels results is a signal that looks like a higher bit version of the original FM modulated square wave. Ahh, the mystery and power of correlation!
The spectrogram image below shows the Crosscorrelation over time while the spectrum region shows a slice. This spectrum slice looks a lot like the original square wave test signal with a center mirror symmetry. Below the main baudline spectro display is the waveform window which shows the delta signal. Note that the top ruler axis isn't really Hz but a time lag.
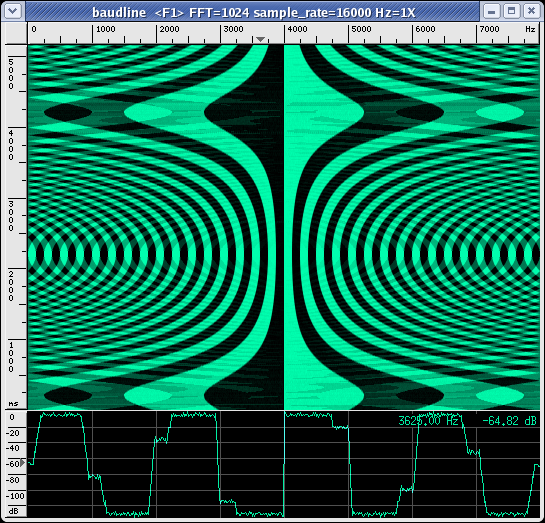

The spectrogram displays some very interesting folded aliasing patterns that are slightly enhanced by the use of the square windowing function. The spectrum section displays some interesting waveform steps that are a mixture of the source signal and the aliasing.

No comments:
Post a Comment