Wednesday, February 22, 2006

Audioblogger.com QoS T&'M

Purpose
Determine the quality of service (QoS) of the Audioblogger.com system by performing some test and measurement (T&M) on the signal channel.

Procedure
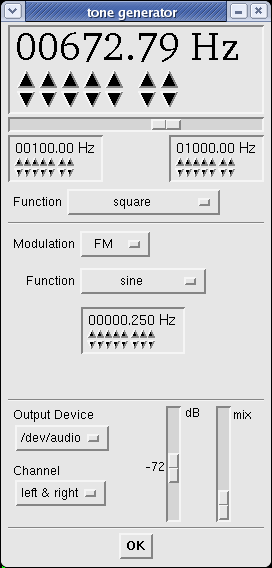
Input a known test signal over a GSM cell phone to the Audioblogger system and then perform distortion analysis on the captured data file. Constant sine wave, linear sine sweep, and white Gaussian noise test signals were created by baudline's function generator. These test signals were played back by a CS4236B codec to Altec Lansing ACS48 speakers and then to the headset microphone of a Motorola v60 GSM cell phone. The captured Audioblogger file was a 24 kbps MP3 audio file with a 22050 sample rate. Click below to listen:

this is an audio post - click to play


This is a complicated signal path that has many potential points of degradation. It is difficult to guess which step is the weakest link. The signal path consists of:

  1. baudline plays test signal
  2. CS4236B DAC (44100 sample rate)
  3. Altec Lansing ACS48 speakers
  4. headset microphone
  5. Motorola v60 GSM cell phone (4 bars)
  6. carrier's GSM to u-law conversion
  7. Audioblogger machine's ADC (22050 sample rate)
  8. MP3 24 kbps compression


Analysis
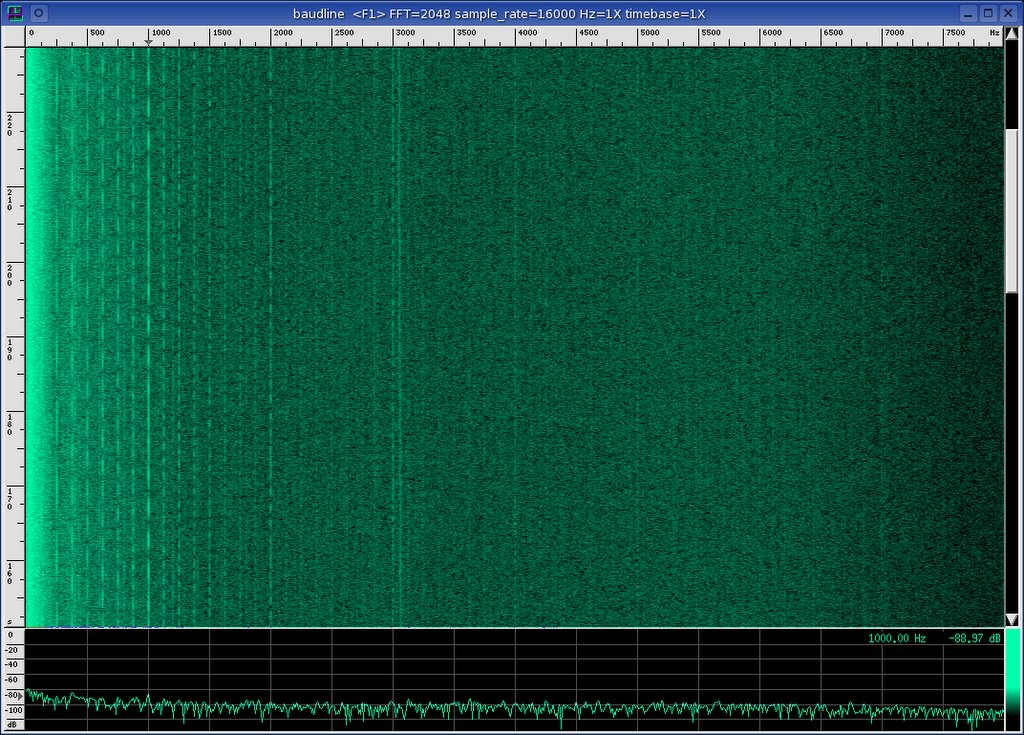
Below is the spectrogram of the entire file. Notice that it is VGC limited at about 4kHz of bandwidth.


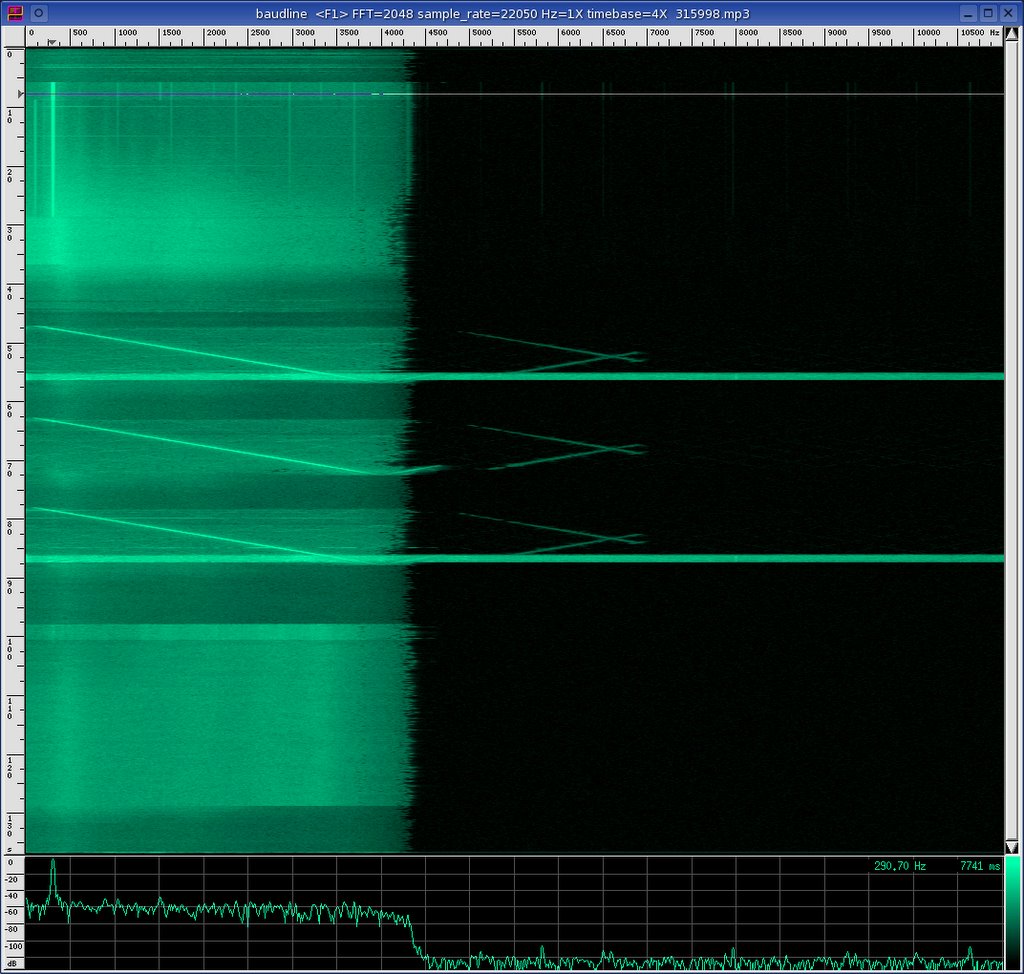
The test signal consists of three different test stimuli. From top to bottom. The first section is a constant sine. The second section has three copies of a linear sine sweep. The third and final section is white Gaussian noise (WGN). In between the tests are sections of silence which are used to measure the idle noise floor.

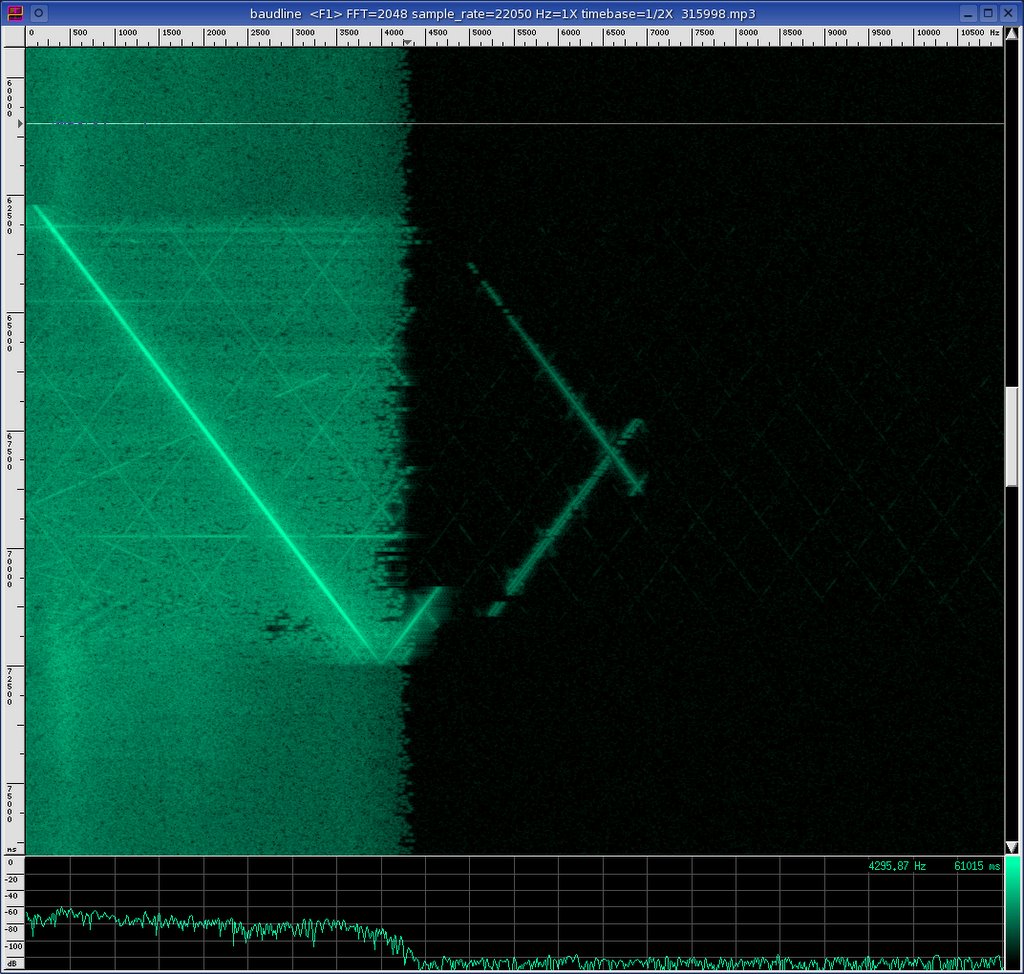
Below is a zoomed timebase version of the first sine wave section.


It looks like an AGC kicks in after about 3 seconds of steady state signal. This isn't good. Signal gain drops by 5 dB and a strong 100 Hz tone appears, then in the final 8 seconds the sine wave looks fizzled out.

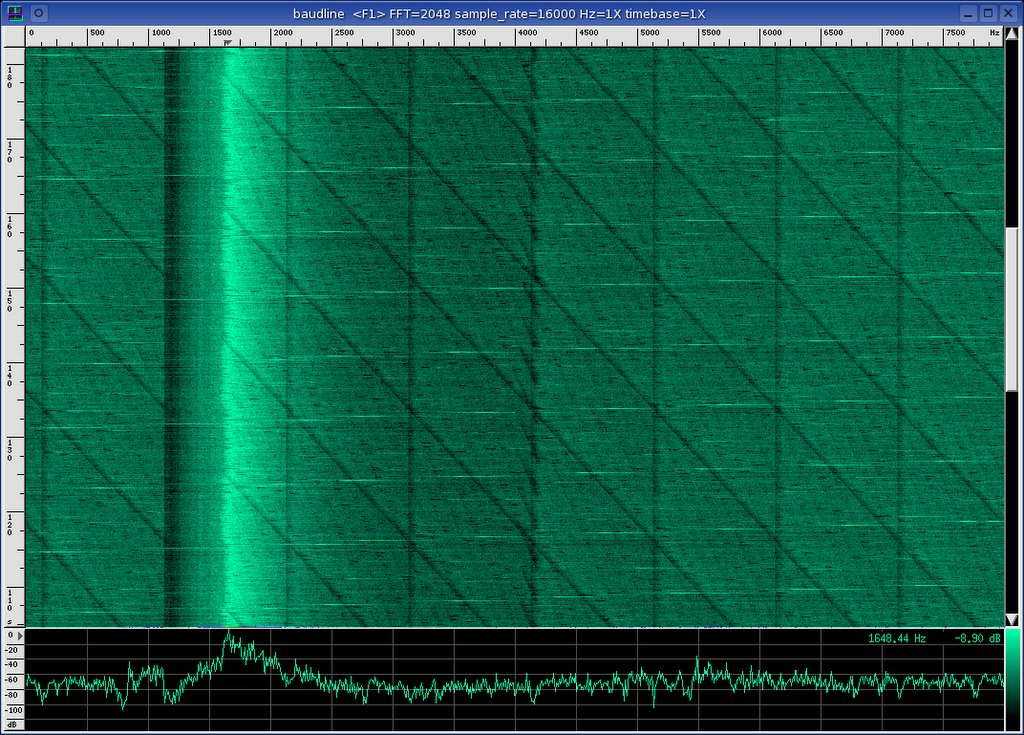
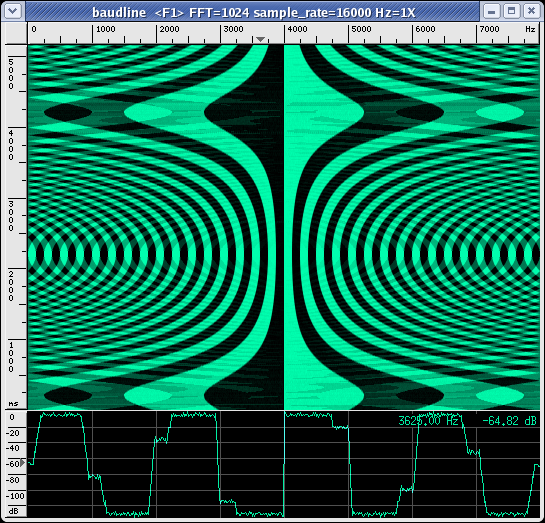
The 2nd linear sine sweep was the cleanest and the zoomed in image is below. The 1st and 3rd sweeps were discarded because they have strong clipping distortion near the end that look like wideband noise. In all three runs notice the crisscross harmonics and the aliasing around the 4kHz Nyquist point.


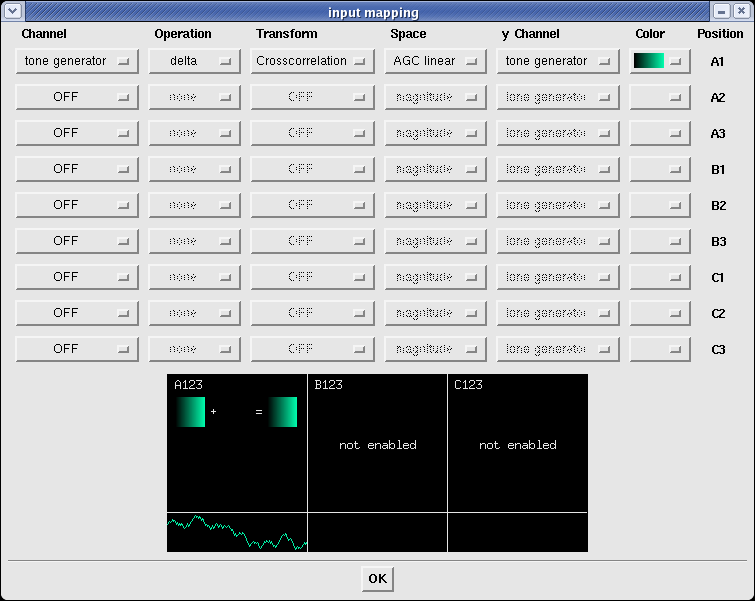
The same baudline DAQ / codec copy-n-paste technique (see references) was used to visualize the individual spectral parts. In the Average window the following colors correspond to the different sections:

  • green - 301.99 Hz sine wave
  • purple - noise floor (silence)
  • orange - white Gaussian noise (WGN)
  • cyan - sine sweep 0 - 4000 Hz


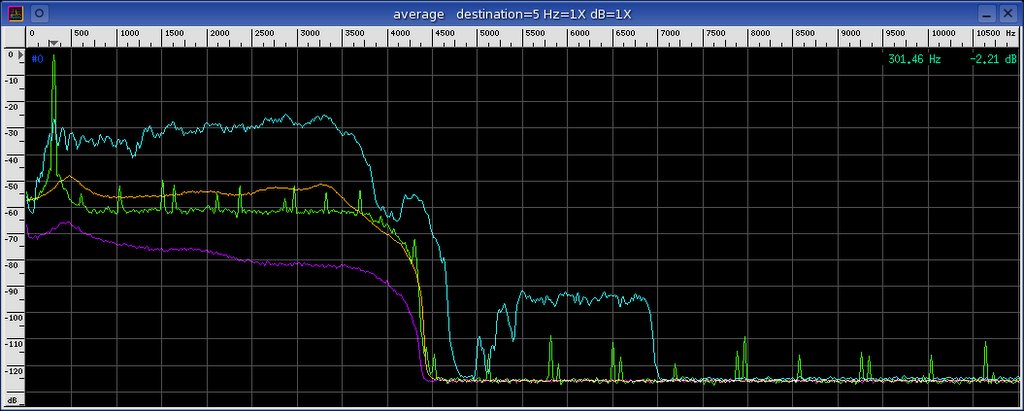
The purple noise floor and orange WGN have subtle peaks at ~460 Hz. The green sine wave has a large number of distortions. The spectrum of the cyan sine sweep is lumpy and resonances are visible. Here are the distortion measurements from the first 2.5 seconds of the sine wave. The numbers drop significantly after that (by about 1.8 bits).

Distortion Metrics:

  • frequency: 301.995 Hz (+16.56 PPM)
  • SNR: +35.16 dB
  • THD: -40.02 dB (0.01 %)
  • SINAD: +33.93 dB
  • ENOB: +5.344 bits
  • SFDR: +41.78 dB


Here are some comparison ENOB's:

  • CS4236B DAC (11.5 bits)
  • GSM 6.10 (8 bits)
  • u-law (6 bits)
  • 24 kbps MP3 (15 bits)


Conclusion
All considered, the final ENOB of 5.3 bits is quite good. The Audioblogger system looks like it will work well for voice. The performance for field recordings is questionable but if all you have is a cell phone then Audioblogger might just be a useful tool.

References
http://www.baudline.com/solutions/full_duplex/
http://www.baudline.com/solutions/codec/

Monday, February 20, 2006

CS4236B PCI bus noise

Strange bus noise of an idle CD channel on an integrated CS4236B codec was captured with the baudline signal analyzer. Configuration: 16000 sample per second rate, CD mixer channel selected, 2048 point FFT. No signal was present so a high mixer gain amplified the background idle noise. The resulting interference is very interesting and it is a function of CPU activity. The spectrograms of three transforms reveal a number of mysterious patterns:

Fourier

Strong 125 Hz harmonics look like pulsing tones from 125 Hz to 2000 Hz. Harmonics of 1000 Hz are also present (2000, 3000, 4000, 5000 Hz). An unusual and unrelated tone is at 3080 Hz. The higher end of the spectrum is fairly flat.

The spectral bump near 0 Hz (DC) is actually made up of periodic broadband pulses that repeat at 0.128 second intervals (2048 samples @ 16000 rate). For a view with increased detailed see the zoomed Fourier spectrogram image on the right. The pulse shapes are that of downward exponential chirps. Occasional 0.064 second period doubles are interspersed. The 64 and 128 ms measurements hint at powers of 2 and at DMA packet transfers.

Autocorrelation

The above image is the Autocorrelation transform with the square windowing function. The Hilbert filter operation was utilized to remove DC and low frequency components that obscure the transform display. The horizontal frequency ruler in this image is incorrect and the units should be samples. The strong spectrogram lines at 1000, 2000, 3000, 4000 Hz, ... represent 128, 256, 384, and 512 samples. What look like weaker harmonics in between the 128 sample tones have spacings of 16 samples The crisscross diagonal lines are fascinating.

Sample Raster

The sample Raster transform has an overlap spacing of 2048 samples. This transform can be thought of as stacked waveforms like a TV raster display. The horizontal units are not Hz but samples. Like the Autocorrelation transform, the sample Raster transform has strong vertical lines at 1000 Hz spacings which convert to 128 samples. Also similar are the diagonal lines that in this case only ramp up. A strong line sync structure exists in the 1000 to 2000 Hz zone. The lower spectrum region is identical to the Waveform window with an AGC linear space function.

The exact cause of these bizarre spectrogram patterns is unknown but CPU and PCI bus noise interference is suspected. For further noise and distortion analysis of the CS4236B and other DAQ's see this baudline solution report:

http://www.baudline.com/solutions/full_duplex/

Thursday, February 16, 2006

Crosscorrelation Spectrogram

The Tone Generator in baudline was utilized as the test signal source for this demonstration of the Crosscorrelation Spectrogram. A square wave function was FM modulated with a sine wave that had a 100 - 1000 Hz range and a 0.25 Hz modulation frequency. The digital gain was set to a very low -72 dB which resulted in a signal that only had ±1 least significant bit (LSB) flipping. This weak test signal was connected to the data analysis stream by enabling the tone generator loopback option in the Input Devices window.


Some advanced baudline wiring configuration was accomplished with the Input Mapping window. First the Crosscorrelation transform with the AGC linear space was selected. Next the delta operation was applied to the left cross channel. This combination results in the Crosscorrelation of the input test signal with it's delta function.


The Autocorrelation of a square wave is a triangle wave but the application of the delta function on one of the Crosscorrelation channels results is a signal that looks like a higher bit version of the original FM modulated square wave. Ahh, the mystery and power of correlation!

The spectrogram image below shows the Crosscorrelation over time while the spectrum region shows a slice. This spectrum slice looks a lot like the original square wave test signal with a center mirror symmetry. Below the main baudline spectro display is the waveform window which shows the delta signal. Note that the top ruler axis isn't really Hz but a time lag.


The spectrogram displays some very interesting folded aliasing patterns that are slightly enhanced by the use of the square windowing function. The spectrum section displays some interesting waveform steps that are a mixture of the source signal and the aliasing.