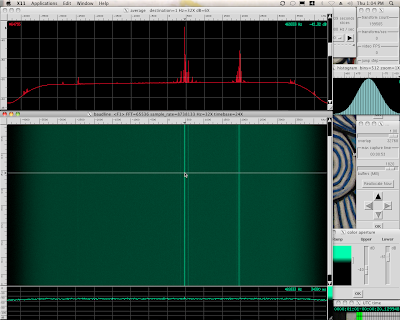
The following command line was used to stream the 5m 26s quadrature setiQuest signal into baudline:
cat ~/setiquest/2010-04-02-amc7-3693.4464-8bit_combined.dat | baudline -session setiquest -stdin -format s8 -channels 2 -quadrature -flipcomplex -samplerate 8738133 -fftsize 65536 -utc 0 -pause
Full 8.738 MHz view
Switching baudline to the record mode allowed the standard input to be collected and displayed. The red Average window reduces the variance of the noise floor and lets weak signals stand out. The green spectrogram is a time vs. frequency plot which shows the presence of several constant tones (straight lines). The Histogram window shows a Gaussian curve (see AWGN) which is customary for noise sampled from an analog digital converter (ADC), notice the alternating blank vertical lines caused by the signed 8-bit sample format. The Color Aperture window allows the upper and lower spectrogram intensity limits to be adjusted for maximum visual sensitivity. See the screenshot below (click for a larger image):

A 65536 point complex FFT was used for display and analysis. The frequency axis was zoomed in to a Hz=1X resolution to focus on the tones at +500 kHz. The screenshot of the zoomed in Average window is below:

The main tone is at 473 kHz with several weaker distortion sidebands. Next we want to zoom in even more to see what is going on.
Decimate by 512
The decimation and down mixer feature in the Input Devices window was used to zoom into the frequency axis which also has the side benefit of increasing the signal's SNR. Decimation by 512 was done combined with a 65536 point FFT which has the equivalent extraction power of a 32 million point FFT. This works out to a bin resolution of 0.52 Hz / bin. The down mixer is a digital down converter (DDC) which works a lot like turning a radio tuner. The down mixer was set to be centered on the strong tone at +473 kHz by setting the frequency range to +464533.3 ... +481600.0 Hz.
 Interesting side note is the 8.3 Msample calibration rate estimate for stdin. The sample rate estimate is a clock measurement of the speed baudline is collecting data, in this case from stdin. This means that baudline is collecting standard input data from a file, decimating, down mixing, calculating a 65536 point FFT, accumulating the Average window, calculating and drawing the sample Histogram, and rendering the scrolling spectrogram in almost real-time on a cheap $500 one-year-old 2.0 GHz Intel Core 2 Duo machine.
Next, the "transform cache" feature was enabled in the Drift Integrator which used 524 MB of RAM to cache the results of the 65536 point FFT for extremely fast frequency axis zooming and scrolling. The Drift Integrator has a number of other useful features such as beam slices, Auto Drift, a folding paste algorithm, and anti-alias on spectrogram zoom which I will explain in a future blog post.

Below is a full screenshot of the result of the decimation and down mixing:

The red Average spectral plot and the green spectrogram show the same range of frequency data but at different Hz scale factors. The strong tone at 473067 Hz and its sidebands are the main concern of interest here. Notice the first sidebands offset by ±979 Hz on both sides of this strong 473 kHz tone are wiggly. Next we will zoom in on one of them.
Zoom Hz=1X
The Command+Left key was pressed several times to change the spectrogram's frequency zoom factor from 32X to 1X. Since the "transform cache" was enabled the zooming and frequency scrolling was extremely fast and responsive. It was like exploring the spectrum with a real-time DSP microscope looking for interesting spectral features. A screenshot of the wandering tone (F2) at 472075 Hz is below:

It was interesting to discover that the sidebands, offset by ±979 Hz, are mirror images of each other. The sidebands (F2) are about 25 dB down from the main tone (F1). The third ±harmonics (F3) are also wandering mirror images of F2, the F4 harmonic is missing, while the F5 is a clean constant tone. Here is a screenshot of -F3:

The wandering -F3 tone is just a weaker version of -F2 with 2x the frequency stretch which is customary for harmonic progressions.
Amplitude modulation (AM) of the strong 473 kHz tone by an unknown signal would cause similar sidebands. They could be distortion products from the transmitter or the radio telescope collection equipment. The wandering looks like it could be oscillator drift of the ADC sampling clock but that is just a guess.
Let's move the frequency scrollbar to look at the strong 473069 Hz tone. Here is a screenshot of the carrier (F1):
 It looks very stationary and popping up baudline's crosshair cursor verifies such at this magnification level.
Decimate by 4096
Let's zoom in a little more. Increasing the decimation factor to 4096 reduces the bin resolution to 0.0651 Hz / bin. Below is a spectrogram screenshot of the strong carrier (F1) at this increased frequency resolution:
 The strong tone has a slight drift of +0.52 Hz over a course of 326 seconds. This is about equal to the bin resolution from the previous decimate by 512 case so it isn't surprising that the signal looked stationary in that view. The increased frequency zoom has made the signal start to look a bit wiggly. What we need is even more frequency resolution.
Decimate by 32768
Baudline has a maximum "decimate by" limit of 4096 so I used a 2-pass method of decimating by 4096, saving the file, then feeding that into standard input again but with a decimate by 8 factor. I call this multi-pass algorithm "decimate by ∞" where you keep taking the output of the decimator and feed it back into the input. You can keep doing this ad infinitum until you end up with zero samples. I could of kept decimating past 32768 but too much time information would of been lost from the spectrogram and resulted in a poor looking image. The bin resolution of decimate by 32768 is 0.00814 Hz / bin. The once stationary tone no longer looks straight in the spectrogram below:

The tone isn't just drifting, it also has an incredible amount of wander to it. I measure a top to bottom drift of +0.35 Hz over 326 seconds. This isn't surprising, zoom in deep enough and even the world's best oscillator is will have some variation but more likely you'll be seeing the error in the ADC clock!
I've seen this deep decimation frequency wandering before in this Mystery Signal.
For fun this is what the decimate by 32768 quadrature signal looks like in the Waveform view:
 Note that most of the noise has been decimated away and a quadrature sine wave is visible. Nice 90º phase shift.
Conclusion
The combination of a large FFT and high decimation factor allow baudline to zoom in for a deep view of weak signal behavior. Using baudline's multiple features allowed for detailed signal measurements and interactive fast browsing of the time-frequency domain.
The setiQuest AMC-07 data file had several stationary tones with strong distortion sidebands. The wandering mirror sidebands are likely caused by oscillator drift of the ADC sampling clock. The non-drifting stationary nature of all tones in this data file suggest the source is of terrestrial origin.
[Update: This thread said that the signal is from the AMC-7 geosynchronous satellite.]

1 comment:
clapping hands in stunned amazement. very nice.
Post a Comment