Today you can use the baudline signal analyzer to explore the setiQuest data. To get access to the data you'll first need to register for a free setiQuest user account. Next you will need to feed the data into baudline and that is the purpose of this tutorial.
There are two ways to get the setiQuest quadrature .dat files into baudline. One is to read them in as a raw data file. The other is to stream them into baudline's standard input (stdin) which is like recording from a microphone but instead using a Unix pipe construct.
raw data file
First thing you'll want to do is set the FFT size to 65536 since these are weak signals. Second, set the Open File window to use the Raw format and then select and open your data file. Next, set the Raw Parameters to the appropriate 8-bit quadrature format. Here is a screenshot of the proper setiQuest raw parameters:

Large data files are going to cause problems because baudline is basically a big RAM based buffer. You will need a lot of RAM and even then they will be clamped at a 2 GB limit. So opening in raw mode is good for small files but very bad for huge files.
stdin
This is the preferred method. Stream the .dat file(s) into baudline using the Unix standard input. This way you can record and pause just as if you had access to the live ATA data stream (as if it was a soundcard). With files and stdin you can process data at the speed you want and at the speed your computer can handle. Fast enough computers can actually record and have scrolling baudline spectrograms in real-time (8.7 MS/s quadrature). Here is a sample command line I use to stream setiQuest data into baudline:
cat 2010-01-22-kepler-exo4-1420mhz.dat | baudline -session setiquest -stdin -format s8 -channels 2 -quadrature -flipcomplex -samplerate 8738133 -fftsize 65536 -pause -utc 0
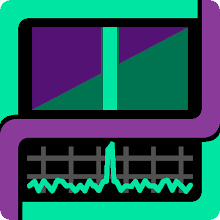
Here is a typical screenshot:

The large green window is the spectrogram display with frequency across the horizontal axis and time on the vertical axis. Vertical lines are constant tones. Sometimes you will see signals moving around in the spectrogram display; pulsing, drifting, wandering, ... The spectrogram display can be scrolled, zoomed, and controlled in numerous other ways.
 Record, Pause, and Play
Use the 3rd mouse button (right button or Command+button) to popup the main menu and select between Record and Pause modes. You can also do this with the controls from the Play Deck. The idea is to record and watch the spectrogram scroll by and then pause it if you see something interesting or if you would like to perform some zooming, scrolling, measuring, or additional analysis.
Baudline has many features that can be used to analyze the data. Remember that the full power of baudline is accessed through the main popup menu. Some of baudline's many other windows have popup menus too.
Decimate and Down Mix
The Input Devices window is used for selecting the sound card and it also works with standard input. The Decimate By and the Down Mixer controls will allow you to zoom into the frequency spectrum much like how a radio tuner works. Decimation adjusts the sample rate so think of it as a way to change how wide a chunk of frequency you want to look at. Decimation is a great way to increase SNR similar to increasing the FFT size. The Down Mixer selects the frequency to look at just like a tuner dial on a radio.
 These controls only work while in the record mode on the incoming data stream. So you can make changes while recording but if you want to change the entire data stream from the beginning you will have make the adjustment, exit baudline which will save your session settings, and then restart baudline from the command line.
I like running several instances of baudline with the same stdin data stream all at the same time. Setting decimation to none will give you the full width of the spectrum. I like doing this as a first pass and keep it around as a map for a second instance of baudline on another screen. I decimate and down mix in that second instance of baudline. Sometimes I have up to ten baudlines open at a time doing different things, managing memory usage is important when I do this.
 Scroll Control
As its name implies, the Scroll Control window is how you control scrolling and manage memory. Baudline is basically a big wrap-around buffer and with this Scroll Control window you control the overlap value, the maximum capture time, and the amount of RAM to dedicate to buffer space.
The overlap setting adjusts the recording mode's scrolling speed. Fast on the left and slow on the right. Don't use it to change the size of the spectrogram image, instead use the timebase zoom controls for that. For setiQuest data I recommend setting the overlap to its maximum 1.0 value. This will let you collect the longest duration of data in the buffer. It will also slow the scrolling rate down so that your computer can better keep up with a real-time stream.
The buffers (MB) slider allows you set the maximum amount of RAM in megabytes that you want baudline to use. Big buffers allow for collecting large amounts of data and for fast timebase spectrogram zooming but they take up a lot of space. Too much RAM allocated means less is available to other applications and the operating system. When RAM gets low things can get slow when memory starts getting swapped to disk. My advice is to use a large buffer when you need to collect a lot of data or for a long time. Use smaller buffers for things like when you decimate by 4096.
The Reallocate Now button will erase all the current data in and reallocate the buffers according to your new overlap and MB settings. Pressing this button will also update the Maximum Capture Time value. Use this button with caution.
Color Aperture
Weak signals have very little dynamic range so the Color Aperture window is a way to control spectrogram intensity.
 Adjust the upper and lower dB values to match you signal's spectral range and maximize your color resolution. Heavily averaged (integrated) signals have a lower variance so the upper and lower controls can be set much closer together without the color clipping.
Average Spectrum
The Average window allows you to integrate (average) a large number of spectral slices. Spectral integration reduces the variance of the noise floor which is useful for seeing weak signals. Zooming into the Hz and dB axis is also very useful for seeing weak signal details.

The Average window operates in the record mode by the on/off collecting of data and in the pause mode by copy-n-pasting chunks of data. The Average window has a number of other useful features such as multiple color spectral traces (F# banks) and exponential decay while recording. These controls are accessed by the Average window's popup menu (3rd mouse button).
Histogram
The Histogram display shows the probability distribution of a waveform's sample amplitudes. The setiQuest data is predominantly noise that has a Gaussian shaped distribution (bell shaped curve). The unusual example histogram below shows the basic Gaussian shape with an offset between the I (green) and Q (purple) quadrature channels.
 Normally the I/Q channels are perfectly balanced and all that is visible is a clean Gaussian shape that is the color cyan which is the sum of green and purple. Here is another Histogram window example that shows distribution gaps due to the signed 8-bit quantized samples. Note that 2^8 = 256 samples.
 The Histogram window is useful for seeing certain types of signal distortions and collection artifacts but it is not useful as a weak signal analysis tool.
Drift Integrator
The Drift Integrator window is a powerful but more complicated set of controls for all things integration related. The beam width control is like averaging for the spectrogram display. The drift rate and Auto Drift controls are tightly coupled to both the Average window and the Spectrogram display.
 I recommend setting the "anti-alias on spectrogram zoom" setting as it will dynamically improve your spectrogram image when you zoom out. The rest of the Drift Integrator settings have a great deal of potential for SETI but they are slightly dangerous so they are for experts only. Read the online manual and become an expert!
More
I've tried to make the setiQuest AMC-07 and the Kepler Exoplanet 4 blog posts as educational / tutorial-like as I can while still reporting useful analysis. I describe all the details and settings that I used so anyone should be able to reproduce my results. Many baudline tips and DSP techniques are hidden within too. I hope you find them helpful.
1 comment:
Thank you for you contributions.
Your posts are indeed educational.
SV1ETK
Nick Kavalieris
Post a Comment